When NAVA first asked me to look at the economics of the S2M visual arts sector I was apprehensive. The idea of putting a dollar value on art filled me with dread, along with the inevitable pile of hate mail I would receive from artists disappointed with the report.
Fortunately, that wasn’t what Tamara and the team had in mind.
Instead, we developed a survey that would gather data on the funding and outputs of the different kinds of organisation that make up the S2M sector and try to map out what they produce and how they are funded.
Like most people outside of the arts world, and like almost all economists, I had always thought that changes in arts funding meant that a few more or a few less paintings and sculptures would be produced. If I’d put more thought into it I might have concluded that changes to arts funding would mean nicer or less nice paintings and sculptures being produced.
This report helps people like me, and more importantly people such as politicians, advisors and public servants, to realise that changes to arts funding have much more complex effects. It helps all of us to see that different kinds of arts organisation get revenue from different sources. It shows that these different organisations perform different roles in different stages of artists’ careers and that they produce different services and artistic outputs.
This may be obvious to many NAVA members, but it isn’t at all clear to people in parliaments and town halls around the country. And what people in parliaments and town halls like even more than a clear explanation of a policy area is numbers that they can quote, based on data they trust.
Data on arts funding is hard enough to come by - the Australian Bureau of Statistics stopped its series on arts funding following cuts in the 2014 budget. Detailed data that links both funding and output of S2M arts organisations over several years has not existed in Australia until now.
The headline figures are impressive – the S2M visual arts sector employs over 2,000 people, puts $100,000,000 into the economy each year and produces 26,000 new works each year with a budget worth just 0.03% of Federal Government revenue. But possibly more important than these overall figures are the details now available on how different organisations are funded and how they interact.
This will give advocates for the arts in Australia the information they need to explain to decision makers exactly who will be affected by their policy decisions, how that will affect those organisations and others that depend on them and what their likely reactions to that policy will be. This will help dispel the more-or-less-paintings way of thinking and help policy makers understand that a policy will affect particular artists at particular points in their career in particular ways. In this way, I hope the report will not only help NAVA advocate for increased funding – which is so clearly needed – but also for better policy that provides support and security for the S2M sector.
Writing a report is only the first step. Using it is just as important. I’m based in Canberra and sometimes see Tamara and the NAVA team in the corridors of Parliament House. I look forward to seeing them here again, hopefully with copies of the report in hand.
Roderick Campbell
Director of Economists at Large
Research Director at The Australia Institute
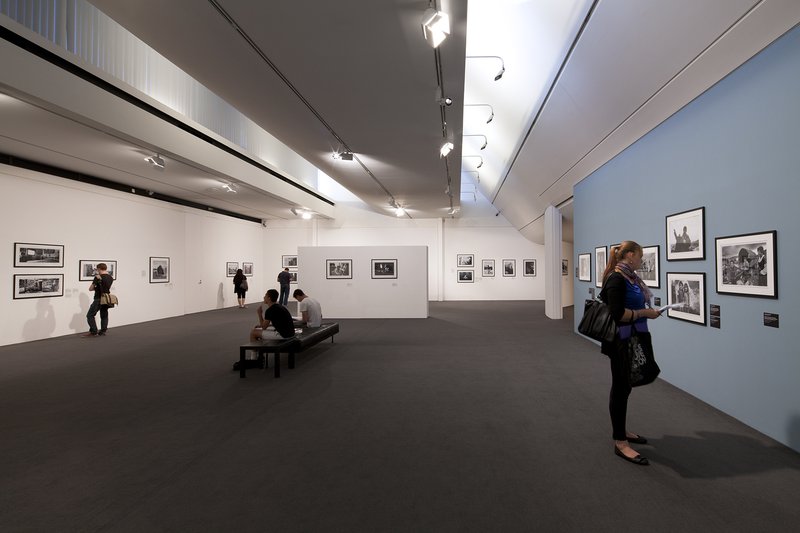
Courtesy Monash Gallery of Art. Photograph: Brendan Finn 2013. Monash Gallery of Art is one of the S2M case studies referred to in the report.


